


To expedite the process of a FIR digital filter, automatic gain control, LPC spectrum and shift matching, the software executes parallel processing using multiple CPUs.
The software detects the number of CPUs automatically. Then, each of the CPUs executes parallel processing for the process.
Parallel Processing Software using Multiple CPUs
Digital Filtering and Segmentation:
Refer to Paper No.11 A flowchart of Figure 1 shows the processing procedure to segment a waveform of the bird vocalization from a three-hour continuous recording.
・In Step 1 of flowchart, a band pass filter with the range of 2000 Hz to 5600 Hz is used to remove the noise of traffic. The band pass filter software executes parallel processing using multi-CPU.
・In Step 2, the energy curves are calculated.
・In Step 3, the energy curves are periodically normalized for each period of time (Auto Gain Control).
・In Steps 4-17, the software segments a waveform of the bird vocalization from a three-hour continuous recording.
・In Steps 2-4, each of the CPUs executes parallel processing.
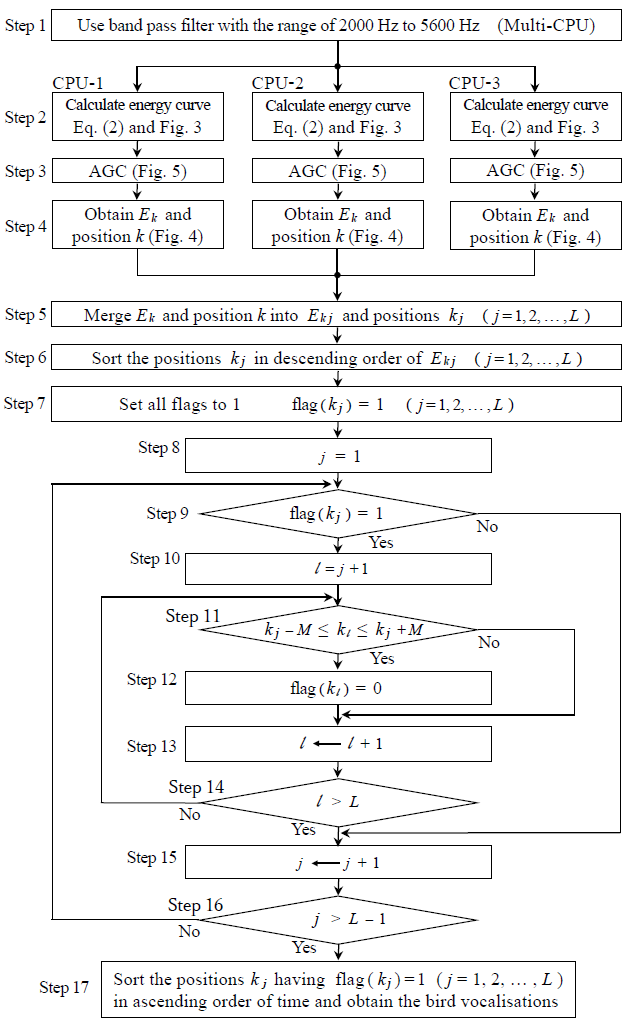
Figure1. Flowchart for digital filtering and segmentation
LPC Spectrogram:
Refer to Paper No.12 A flowchart of Figure 2 shows the processing procedure to calculate a two-dimensional spectrogram extracted from the sound generated by tapping a concrete test specimen with a hammer.
・In Step 1 of flowchart, a high pass filter with the range of 500 Hz to 24000 Hz (sampling frequency = 48000Hz) is used to remove the noise of wind generated when the hammer is swung down. The high pass filter software executes parallel processing using multi-CPU.
・In Step 2, the software detects and segments impact sound waveforms automatically from a continuous recording using multi-CPU.
・In Step 3, the waveform is segmented with 1.062 msec frame width and 0.021 msec frame period, and a one-dimensional (frequency-power) LPC spectrum is calculated in each frame. In Step 3, each of the CPUs executes parallel processing.
・In Step 4, a single CPU merges the individual LPC spectral slices (frequency-power) calculated in Step 3 into a two-dimensional spectrogram (time-frequency-power).
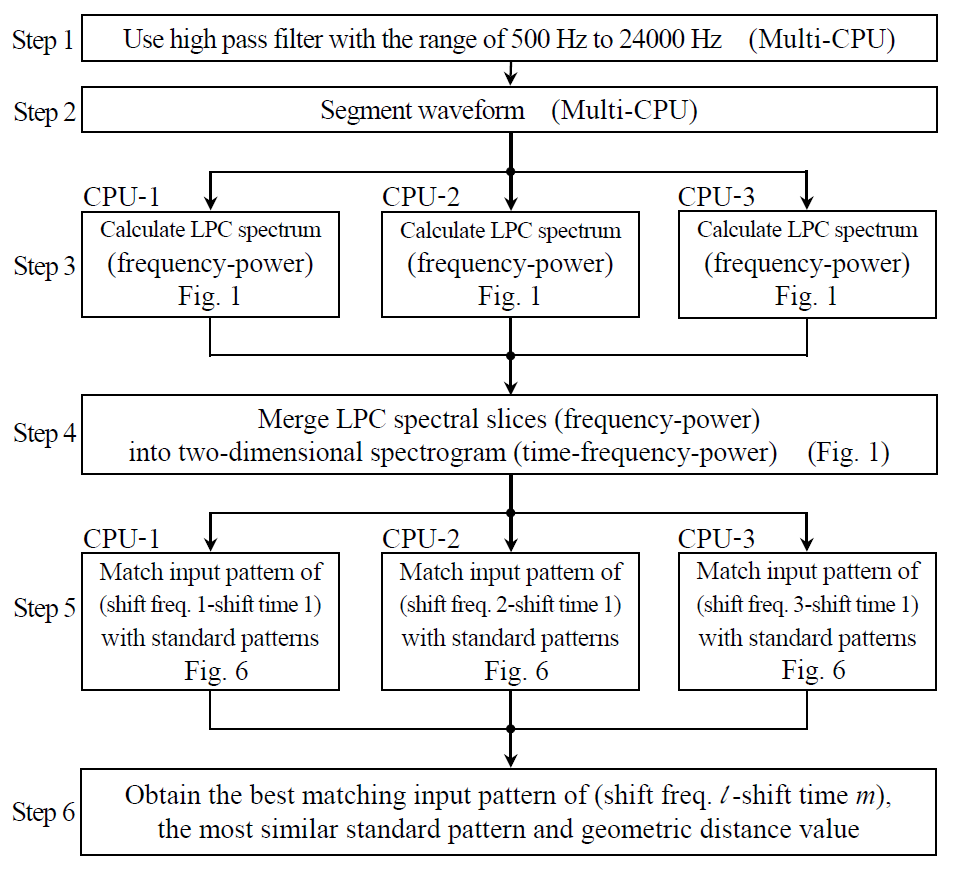
Figure2. Flowchart for LPC spectrum and shift matching
Shift Matching:
Refer to Paper No.12 The diagram at the top left of Figure 3 shows a typical example of the input pattern that shifts in the directions of the frequency and time axes on the spectrogram of the input sound.
We obtain the input pattern by cutting the spectrogram through the window. The software matches the input pattern with the standard pattern accurately, even if the vibrational frequency varies greatly.
The bottom diagrams of Figure 3 graphically represent a good match between the input sound with an abnormal sound.
Step 5 of Figure 2 described above shows the shift matching method. Note that each of the CPUs executes parallel processing for the process of Step 5.
In Step 6, we obtain the best matching input pattern of (shift freq. l-shift time m) and the most similar standard pattern.
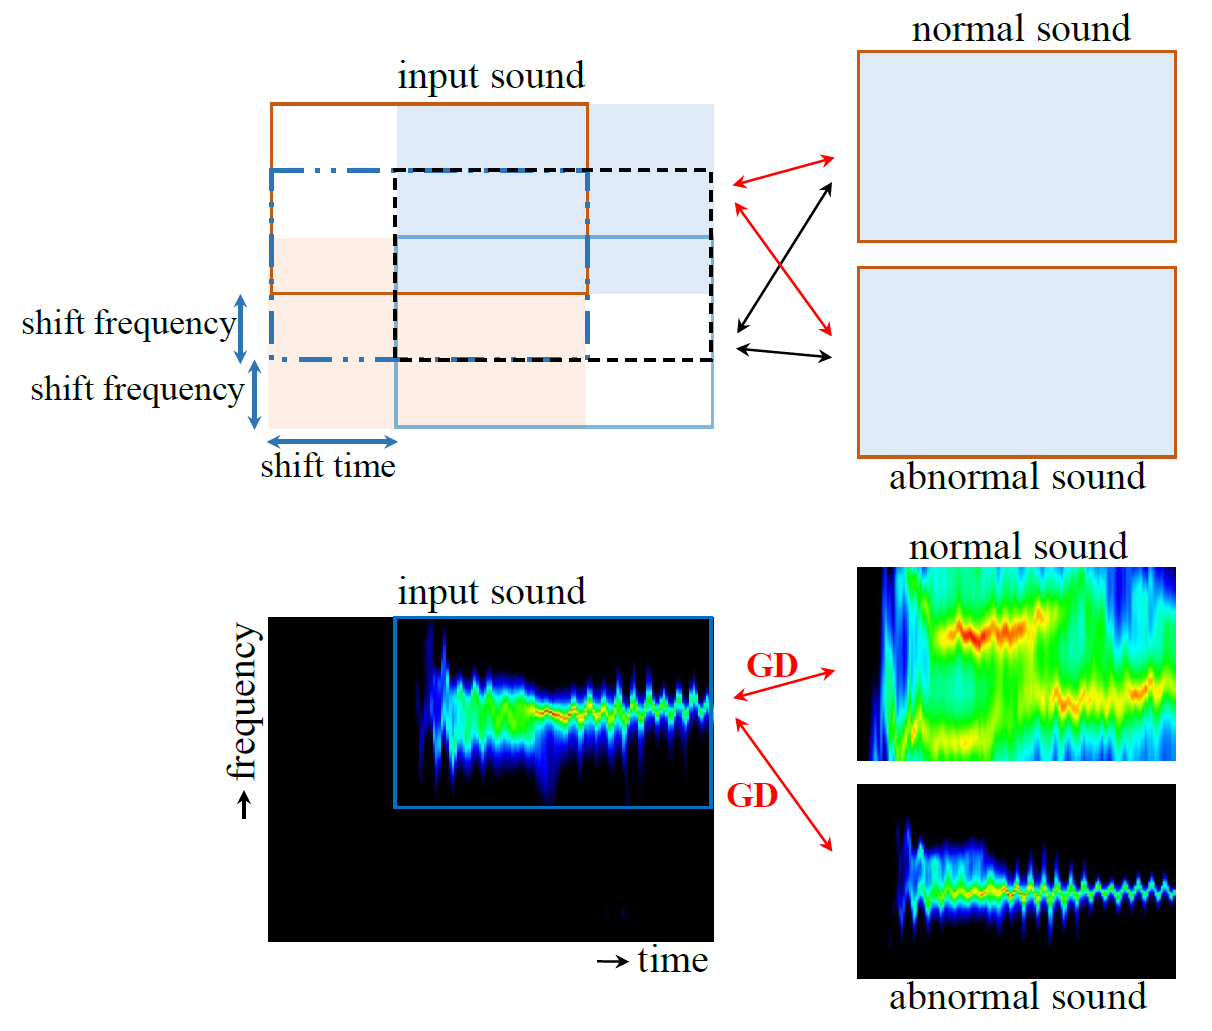
Figure3. Shift matching of input pattern
A single PC has multiple CPUs (2-18 cores) and a single software can use these CPUs simultaneously.
In Windows 10, the task manager shows the performance of the CPUs in percentage.
We have the software which detects the number of CPUs automatically and executes parallel processing using them.
